Canal Building | Occupancy | Wi-Fi Occupancy
Wi-Fi Occupancy
The Wi-Fi Occupancy tool estimates occupant presence in a building by analyzing anonymized device connection counts from multiple Wi-Fi access points located within and around the building. The tool presents data using 25th, 50th (median), 75th, and 95th percentile values, which represent low, typical, high, and highest occupancy scenarios based on historical distributions for the selected time of day and academic term. These insights support data-driven decisions for space planning, ventilation control, and energy optimization by offering a non-intrusive, scalable view of occupant behavior.
Select the academic term (e.g., Winter 2024) and range using the dropdown menus, which will update the display to reflect occupancy data for the chosen context. The heat map represents the spatial range where connected devices - and therefore people - are likely situated, based on the coverage zone of each access point. The plotted values indicate occupancy levels across the selected range, and percentile lines - low, middle, high, and highest - provide statistical context.
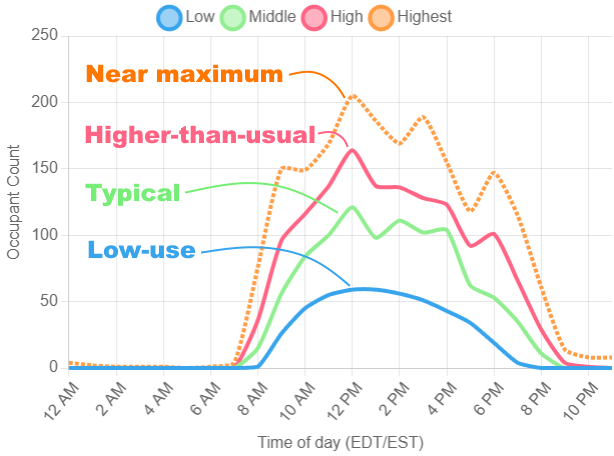
- Low: Occupancy is lower than this value 25% of the time, indicating a relatively low-use scenario.
- Middle (Median): Half of all recorded occupancy values fall below this level, representing a typical or average condition.
- High: Occupancy exceeds this value only 25% of the time, showing a higher-than-usual scenario.
- Highest: Only the top 5% of recorded occupancies are higher than this value, representing peak or near-maximum observed levels.
Note that these are estimated values and may not be representative of real occupant behaviors.