EDC Building | Fault Detection & Diagnostics | Mixing Box Dampers

Outdoor Air Ratio
Health Index = %

Mixing Box Dampers

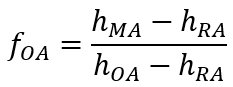
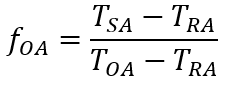
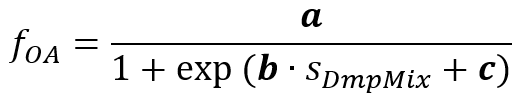
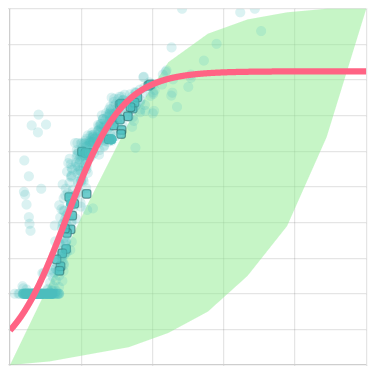
The Outdoor Air Ratio chart lets you monitor the relative amount of outdoor air in the supply air. The AHU's mixing box dampers modulate the intake of outdoor air in the supply/discharge air. The Air Movement and Controls Association (AMCA) specifies an acceptable ratio-to-position relationship for parallel-blade dampers as the green highlighted area in the chart. Excess points outside the ideal region may be symptomatic of seized or uncalibrated system-level dampers which may require corrective actions. Faulty dampers may result in inadequate or excess intake of outdoor air, causing unhealthy indoor air quality or excess energy for heating or cooling.

If an excess number of points or much of the Best-Fit Curve strays from the green highlighted area, this is indicative of faulty mixing box dampers. Faulty dampers can allow excess outdoor air intake, driving up cooling or heating energy use, or insufficient intake resulting in poor indoor air quality.
If faulty mixing box dampers are suspected, it is recommended to investigate for any blockages, leaks, or seized movement of the dampers. If none exist, consider recalibrating or replacing the damper position sensors as they may be faulty and inaccurate.
Example Outdoor Air Ratio chart with too little outdoor air.
Too little outdoor air! ❌

May cause poor indoor air quality.
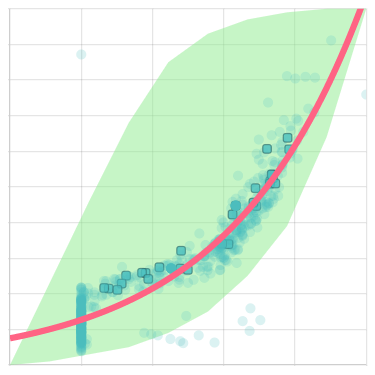
Recommendations: Check mixing box dampers for stuck shut dampers and blockages.

Example Outdoor Air Ratio chart with just right outdoor air.
Just right! ✅

Healthy operations.

Recommendations: None.

Example Outdoor Air Ratio plot with too much outdoor air.
Too much outdoor air! ❌

May cause excess energy use.

Recommendations: Check mixing box dampers for stuck open dampers and leaks.

The Health Index is calculated as the proportion of the Best-Fit Curve within the green highlighted area. The Best-Fit Curve estimates the ratio-to-position relationship and is updated daily using all available data points. A higher Health Index indicates healthy operations of mixing box dampers.

The Outdoor Air Ratio chart was generated using inverse greybox model-based algorithms. First, realize that the ratio of outdoor air in the supply air fOA can be represented by the differences in enthalpy h in Equation A, where OA, RA, and SA represents outdoor air, return air and supply air, respectively. Assuming there is no heating or cooling input to the mixed air, and where relative humidity is not measured, the outdoor air ratio can be approximated using the difference in temperatures T in Equation B. Due to these assumptions, the outdoor air ratio is calculated using only data when the heating and cooling coils valves are completely closed and when the fan is on. The Best-Fit Curve is then fitted to the data points by estimating the parameters (a, b, c) of Equation C and plotting the relationship between outdoor air ratio fOA and mixing box damper position sDmpMix.
FDD MBD Equation A
Equation A
FDD MBD Equation B
Equation B
FDD MBD Equation C
Equation C